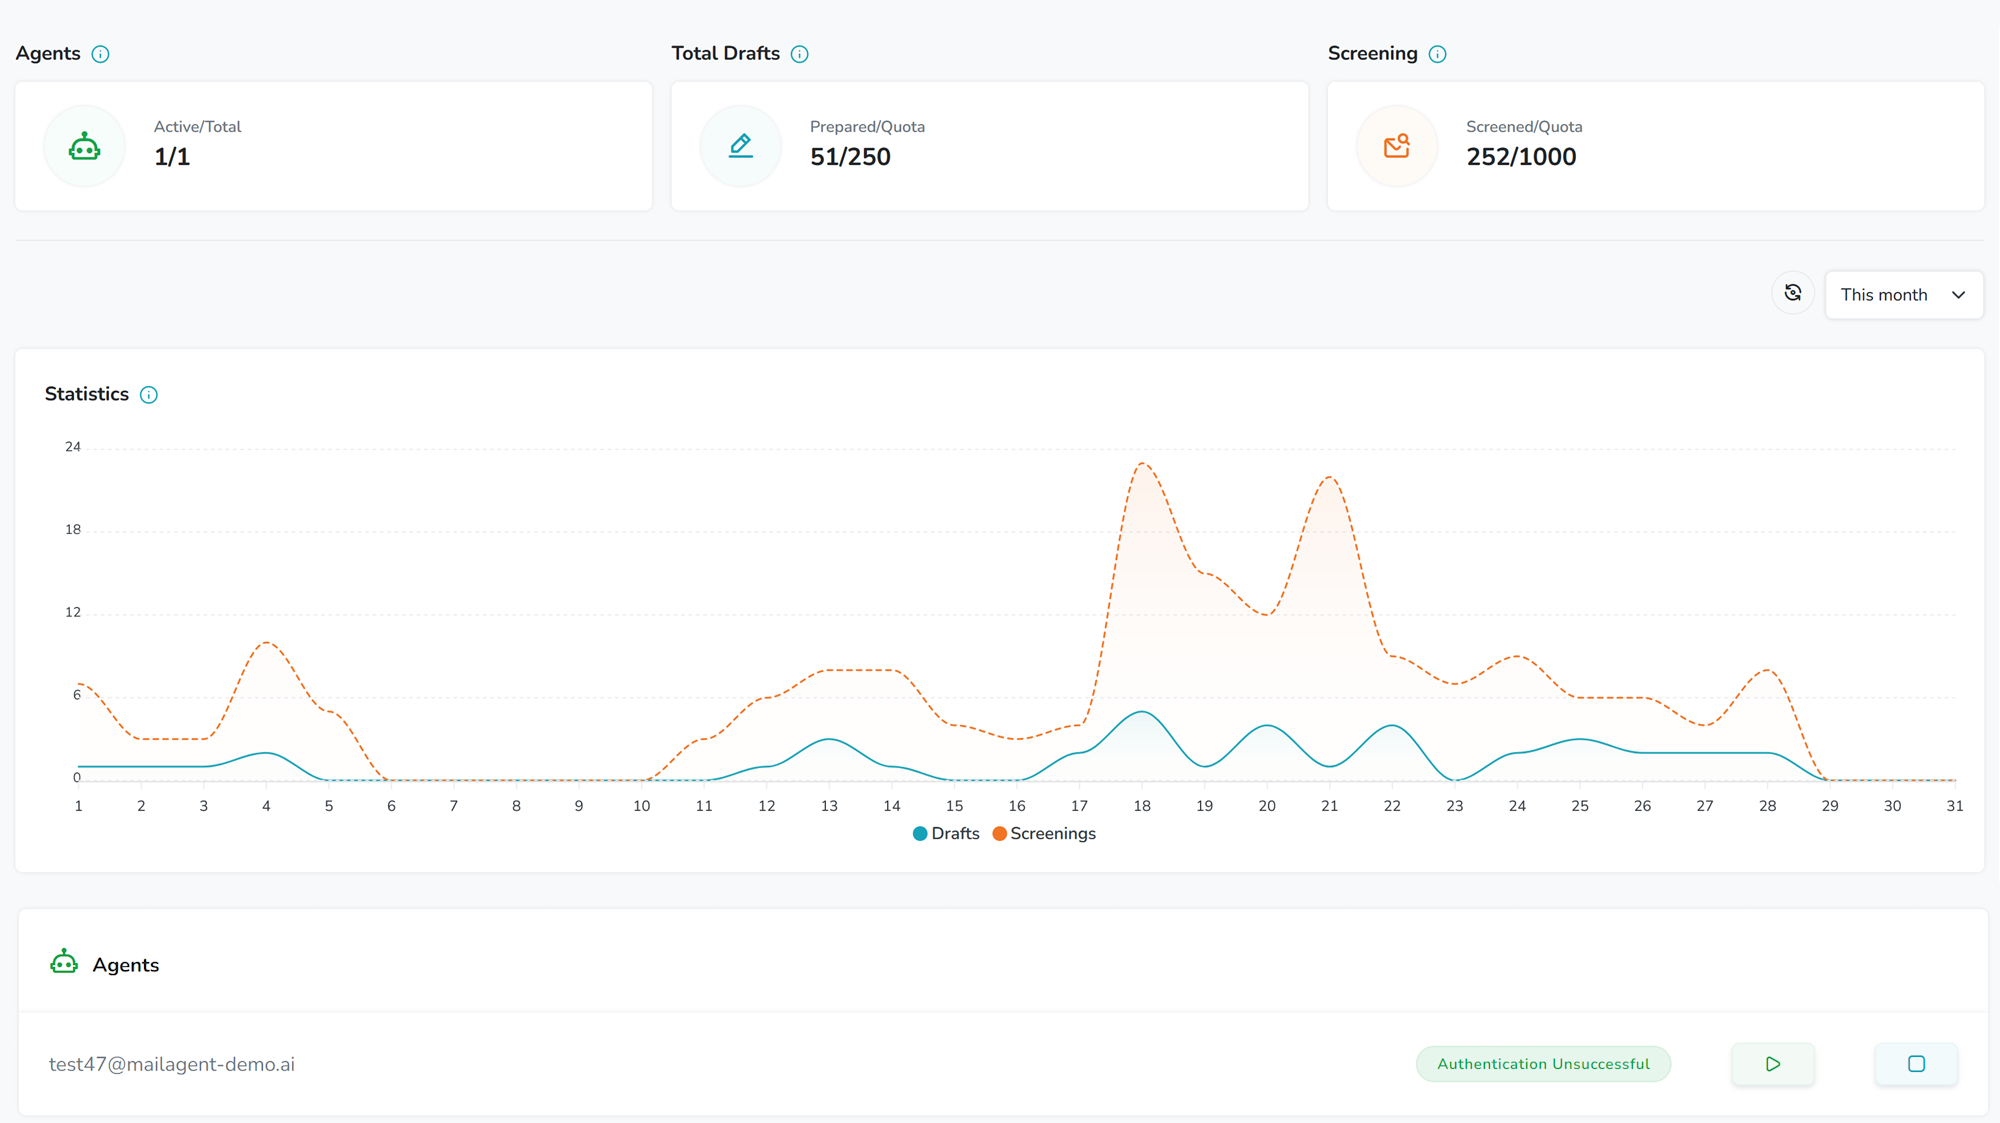
Your MailAgent.ai Dashboard is the nerve center of your email management system, designed to give you a quick, comprehensive view of your email activity and the performance of your AI agent. This guide will walk you through the layout of the Dashboard, explain the key metrics displayed, and offer insights into how to leverage this information to optimize your email management strategies.

This metric offers a quick snapshot of your AI agent workforce by displaying two key numbers: the count of active agents and the total number of agents associated with your account. An 'active' agent is one that is currently online and handling emails, while the 'total' count includes all agents, even those that are not currently active.
Diverse Operations - If your organization operates multiple businesses or has various customer service channels across different email accounts, having multiple agents can be advantageous. Each agent can be specialized to handle the unique demands of each business or service channel.
The 'Drafts' metric on your Dashboard displays the total number of email drafts prepared by your AI agents. This figure is presented alongside the quota assigned to your current price plan, providing a straightforward comparison of your usage against the size of your package.
Budgeting for Growth - If you find your usage regularly approaches or exceeds the allocated quota, it may be indicative of business growth and the need to upgrade to a higher-tier plan that offers a larger quota of drafts.
The 'Screenings' metric on your dashboard reflects the number of incoming emails your AI agents review to determine their eligibility for draft responses. Screening involves checking if an email contains a question, assessing its relevance to your business, and determining its importance for customer service. This process ensures that AI-generated drafts are reserved for emails that truly require engagement. Each screening contributes to the monthly quota allotted in your pricing plan.
Understanding Your Quota - The screening quota in your plan determines how many emails your AI agents will evaluate each month. If your business experiences a high volume of incoming emails, ensure your plan's quota accommodates this influx to prevent any disruption in service.
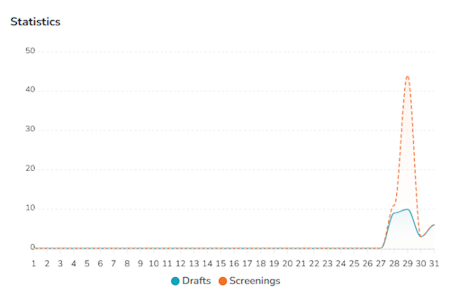
The usage graph is a key feature on your MailAgent.ai dashboard, offering a monthly visual representation of your AI agents' performance. This graph is essential for monitoring the volume and pattern of your email interactions over time. It illustrates the relation between the two core activities – conducting screenings and creating drafts – allowing you to assess the efficiency and balance of your AI agents' workload.

Interactive Elements - By hovering your cursor over individual data points, you can view the exact count of drafts and screenings for each day. This interactivity gives you a granular look at your daily operations.
Historical Comparison - The graph includes a dropdown menu that lets you navigate through the past three months. This capability is designed to offer a concise, actionable window into your recent operational history, helping you identify trends or the impact of any adjustments you've made.
Planning Ahead - Understanding your recent email activity trends will help in forecasting future needs. This is crucial for anticipating busy periods and ensuring you have adequate resources allocated to manage increased email volumes.

This list not only displays each agent's status but also provides quick access to their individual settings, performance metrics, and more. It's designed to give you an overview of your entire AI workforce at a glance, highlighting active vs. inactive agents, their assigned email accounts, and any specific configurations you've set for them.
Viewing Agent Details:
Each entry in the list corresponds to an individual AI agent. Clicking on an agent's Email or row will take you to a detailed view, where you can see comprehensive information about the agent's performance, including the number of drafts created, emails screened, and other relevant metrics.
Status Indicators:
Agents are marked with status indicators, showing whether they're currently active, inactive, or if there's an issue that needs your attention.
Control Buttons:
To the right of the status, there are two control buttons. The play button (triangle icon) is used to activate or resume an agent's operations. Conversely, the pause button (square icon) allows you to temporarily disable the agent without removing it from your account.
Take advantage of our free monthly plan, which includes 200 drafts and 1000 screenings. Discover how AI can transform your email management effortlessly!